Friday, September 30, 2016

VDI on VxRAIL - Sizing Consideration


VxRAIL is joint collaborative HCI (Hyper-converged Infrastructure) solution by EMC and VMware. Its a fully integrated, preconfigured, pretested HCI solution with vSphere and VSAN sitting at the core of it.

VxRAIL is available in multiple variants, for both Hybrid and All-Flash models (VxRAIL)

One of the most common use case for VxRAIL is for VDI deployments. While some of other posts highlights VDI sizing consideration, VDI on VxRAIL needs some further due diligence.


Here are things you may want to consider while planning for VDI on VxRAIL
  • VxRAIL appliance considered for hosting VDI workload (VxRAIL model defines the compute capability)
  • Maximum number of appliances you may want to have in a cluster
  • Hybrid or All-Flash model (As of today, only All-Flash supports De-duplication and Compression, Erasure Coding etc.)
  • Type of User workload - this will define 
    • De-dupe and compression ratio that can be considered
    • Read/Write Cache Ratio at VSAN level
  • Availability considered during VSAN sizing (FTT=1, FTT=2, Erasure Coding=RAID5/6)
  • Additional/Spare Storage Capacity for 
    • Recover Point VM 
    • Snapshots
    • Swap files etc.
    • Future Growth
Besides these points, you should treat it as standard VDI with Virtual SAN sizing. 
If still in trouble, reach out to your VMware Account SE and he should be able to help you with the sizing.


Thursday, September 29, 2016

VSAN 6.2 - Capacity Planning for Overheads


While creating VSAN Disk group all the disks are formatted with an On-Disk File System.
Like any other File system "VSAN-FS (format type)" has some overheads. This should be considered while capacity planning in VSAN environment.

VSAN 6.2 introduced VSAN-FS version3 (V3) on-disk file system format. This format has an overhead of 1% + Deduplication Metadata

So in practicality 1% of disk capacity + additional Deduplication Metadata overhead should also be factored while capacity calculation.
Here Deduplication metadata overhead refers to the Translation tables and Hash mapping tables created to achieve Deduplication and Compression.

Deduplication metadata is highly variable and depends on the configured data-set (configured during Storage Policy creation)

This can be observed in the Cluster -> Monitor -> Virtual SAN -> Capacity View.

Besides the 1% File System + Deduplication metadata overheads, VMware also recommends considering additional 30% Slack space capacity of the raw storage post disk formatting.

Slack space is to accommodate automatic rebalancing of data when a disk reaches 80% threshold of its capacity. When rebalancing starts it adds to the rebuild traffic on the cluster.
To avoid the traffic surge, VMware recommends to have capacity limited to 10% lesser than the threshold limit...hence 30% additional Slack space capacity.


In summary, besides the FTT/Erasure Coding overheads,  we should also consider 1% File System overhead, Deduplication Metadata overhead and 30% Slack Space Capacity Overhead.


Thursday, September 22, 2016

Virtual SAN - Fault Domain Design Considerations


Fault Domains (FD) in Virtual SAN environment is a concept introduced to provide a Rack/Chassis level redundancy.
In case your Virtual SAN Cluster spans across racks and server chassis (Converged or Hyper-Converged) and you want to hosts to be protected against rack or chassis failure, then you must create Fault Domains and add one or more hosts to each fault domain.

VSAN follows a distributed data locality algorithm to distribute the constructs of an object (replicas/witness/parity etc.) across disk groups of different servers. 

But with additional configuration of Fault Domains, we can enforce VSAN to also distribute the constructs across servers placed in different racks a.k.a Fault Domains than just distributing it across servers within same rack.
So with an appropriate FD design, we can achieve resiliency across rack failures as well.

What do we need to do this.
Firstly we need to ensure that our VSAN Fault Domain configuration matches our server placement in racks.
Let me explain with an example.

Consider below scenario. We have 8 Rack servers forming a VSAN cluster.
I would need a minimum of 3 Fault Domains to be begin with. That's because Fault Domain count = 2 x n + 1
where, n = No. of failure to tolerate

However for best results 4 or more Fault Domains are recommended.

So let's take 4 Fault Domains in the example.


The Blue VM is running with a Storage Policy of FTT = 1
The Orange VM is running with a Storage Policy of Erasure Coding = RAID 5

Since we have configured Fault Domains to include respective ESXis as shown on the right side of the image, you can see the data block for an object are written across the fault domains.
However in absence of FD configuration matching server placement, the data might have got written across servers within the same rack.

This is just an illustration, but to know the exact distribution of the Object blocks, use vSphere Web client go to Virtual Machine -> Monitor -> Policy...Click the Object and check Physical Disk Placement.


For balanced storage loads consider below points as guidelines for configuring Fault Domains
  • Minimum no. of Fault Domains in a VSAN Cluster is 3. For best results configure 4 or more fault domains
  • Possibly assign same no. of hosts to each fault domain
  • Use Hosts with uniform configuration (from disk and compute perspective)
  • Dedicate one Fault Domain of free capacity for rebuilding data after a failure.


Wednesday, September 21, 2016

VMware Virtual SAN - Power of Policy Based Management


I happen to get my hands on one of the VSAN pod in our lab and wanted to check how much does Read Cache ratio configuration impacts the workload.

Hence i planned a simple scenario to test out the impact of Read Cache Ratio. This post shares the findings i had.

My setup is a moderate setup with 4 node Hybrid VSAN cluster running on Dell PowerEdge C6220 II  servers with 16 CPU cores and 192 GB RAM.
Each server contains 1 x 400GB SSD drive and 3 x 1 TB SAS drives.

To test out my scenario, firstly i created two Storage Policies. 
The only difference in the Rule Sets of the 2 policies is the Read Cache Ratio. See screenshot below.


The 1st Storage Policy has "Flash Read Cache reservation" as "NIL", whereas the 2nd Storage Policy has "Flash Read Cache reservation" as "7%"

I then created 2 VMs ("VSAN-Win-Test" & "VSAN-Win-Test2") running Windows 7 x64 bit OS, each mapped to one of the above Storage Policy respectively.

Next i installed IO-meter in both the VMs to pump dummy load on VSAN.

Note: Load was produced on both the VMs at different time intervals to get isolated results.

Since i didn't have heavy disk duty disks in my VSAN lab, i planned to simulate a VDI like workload pattern using IO-meter
The Workload profile was : 2 Workers, 4 KB block size, 70:30 - Read/Write Ratio with Sequential IOs.

Let me share the findings of each test one at a time

Test 1 : 
VM Name: VSAN-Win-Test
Storage Profile: Virtual SAN Default Storage Policy
Time Interval: 3:00 PM to 4:30 PM


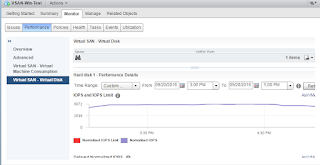
This Image represents the Total IOPS produced by this VM (with IO-meter pumping the load) in the measured time interval.
The interesting part is to observe what was happening in the backend (at the disk level) on VSAN.
Remember the IO profile was 70:30 R/W, which means there should have been more Reads than writes. But if look at the image closely, you would see that there were far more Write IOPS on the disks than the Read IOPS. 
Well this is not a Bug...This is because the Reads are first addressed from the cache-tier and what ever is not found in the cache-tier is then fetched from the Capacity tier.

Remember, this graph shows what's happening at the backend i.e. the Capacity Tier only.

Result 1: 

With no Cache Reservation and with a moderate IO profile and disk configuration (described above), i was able to achieve a roughly 5000 IOPS consistently.

The breakup of these 5000 IOPS can be seen in the IO-Meter screenshots shown below


>>>>>>>>>>>>>>>>>>>>>>>                                            <<<<<<<<<<<<<<<<<<<<<<<<<


Test 2 :
VM Name: VSAN-Win-Test2
Storage Profile: Modified VSAN Storage Policy
Time Interval: 6:00 PM to 7:00 PM


This Image represents the Total IOPS produced by this VM (with IO-meter pumping the load) in the measured time interval.


Now the observation on VSAN Backend IOPS graph in Test 2 is quite interesting. 
And to explain it better i would want to put the side by side to the earlier test result.


Suggest to click and enlarge the above picture. Its a comparison of what's happening at the VSAN disk level in the 2 test results.
In the first LHS image since there is NIL Read Cache reservation - hence there were a lot of Read IOPS which were hitting the Capacity Tier.

However in the RHS image, we configured Storage Policy with 7% Read Cache reservation hence the Read IOPs hitting the Capacity tier over a period of time went down to almost negligible.
That's because a good amount of Read IOs were catered from the Cache-Tier.

hence the Result 2:-

A whooping increase of 2500 IOPS than the previous results, with the same server/disk config, same VM configuration and same workload pattern.
The earlier result showed a consistent 5000 IOPS delivery, but with just a minor tweak of the Cache reservation value i could achieve a consistent 7500 IOPS without any other change in the setup.


Of course the benefit of Read Cache reservation is subjected to the type of workload running. Hence it becomes all the more important for a consultant to understand what are we sizing for. 
Knowing the capacity, IOPS and Latency alone is not just enough. We need to also know the application behavior.
Things like
> What kind off workload is it? Web, App, DB
> What the IO pattern? Is it Read or Write Intensive, Is it Random or Sequential IOs, What's the regular block size.

These additional inputs can help us design the solution in much better manner.

Hope you liked my post. Thanks for reading.


Sunday, September 18, 2016

vRealize Automation 7.1 - Configuration Setup difference from vRA 7.0


You must be aware of the new vRA 7.1 release by now.
Most of you would have deployed it already in your production setup or lab at least.

For readers who are still yet to try the setup of vRA 7.1, there is a fantastic blog from my learned friend - Sajal Debnath @ vtechguru.com

Has has a series of posts describing step by step procedure of deploying and doing initial configuration of vRealize Automation 7.0. While most of it remains the same for vRealize Automation 7.1 besides a small change which i would want to highlight in this post below.

If you go through his article on http://vtechguru.com/2015/12/part-iii-vrealize-automation-70.html

Check out the screenshot in the above link named "Endpoint Details". The configuration wizard in the vRA 7.0 setup used to ask for the following inputs

1) Endpoint Name: Name specified for the endpoint during vSphere Proxy agent installation (while vRA appliance/IaaS is been installed and configured)

2) Endpoint host: FQDN of the host where endpoint agent has been installed. Generally the IaaS server FQDN

3) Endpoint Compute Resource: The Endpoint FQDN itself, which needs to be managed by IaaS (i.e. vCenter FQDN in case of vSphere env.)


However there is a slight change here in vRA 7.1 configuration wizard...
The above listed options have been tweaked and below details are been asked for

1) Endpoint Name: This remains same as above

2) Endpoint FQDN: Its the endpoint FQDN itself, which needs to be managed by IaaS (i.e. vCenter FQDN in case of vSphere env.)

3) Endpoint Resource: Resource you want to manage in your endpoint (like a Cluster in vCenter). This can be later appended or modified in the "Infrastructure-> Fabric Group" section.


I spent some 15 mins extra figuring out this change by checking through the logs and vRO service designer. Hope you find this post useful and like the new vRA release.