Sunday, November 27, 2016

Upgrading vRealize Operations to 6.4


vRealize Operations 6.4 brings in some really cool advancements in the UI along with some 13 new and amazing out-of-box dashboards. The new Dashboards provide 
a) Summary of the environment
b) VM troubleshooting capabilities. Deeper details like OS, IP address etc.
c) Infrastructure performance and capacity details at the Datacenter level. It now provides key performance indicators for an objects and has ability to highlight issues and related objects to it.

Besides this also introduce support for vSphere 6.5 and Predictive DRS (pDRS)

Predictive DRS : Predictive DRS (pDRS) can proactively load balance a vCenter Server cluster to accommodate predictable patterns.
Where DRS performs load balancing of hosts within a cluster by considering the last five minutes of virtual machine demand, Predictive DRS acts based on data provided to it by vRealize Operations Manager. 
vRealize Operations Manager monitors virtual machines running in a vCenter Server, analyzes longer-term historical data and provides forecast data about predictable patterns of resource usage to Predictive DRS. Predictive DRS moves to balance resource usage based on these predictable patterns.

So in all, vROPs 6.4 brings in a lot cool features which are worth an upgrade.

However there are a few pointers which needs to be considered before you rush to an upgrade
1) Upgrading older versions of vRealize Operations Manager (6.0.x or 6.1) must use a two-step upgrade...They must first upgrade to vRealize Operations Manager 6.3 and then upgrade to vRealize Operations Manager 6.4

2) For recent versions of Realize Operations Manager (6.3, 6.2, or 6.2.1), we can upgrade directly to vRealize Operations Manager 6.4
3) Upgrading to vROPs 6.4 includes upgrading 2 pak files
a. The OS pak file
b. the Virtual Appliance pak file 
4) Make sure a snapshot of each node in the vROPs cluster is taken before we start the upgrade
5) Take a backup of any customization, configurations, custom dashboard etc. being created before the starting the upgrade procedure.

Follow the instructions on the "Updating your Software" Link and you should be able to upgrade to vROPs 6.4 without any issues.

VMware Identity Manager Integration with Access Point


VMware Identity Manager also known as vIDM is recently introduced SSO engine which is now used across VMware solutions around EUC and Mobility solutions.
Most of the customers love vIDM is because of its ability to provide single unified interface for accessing your application, which could be apps delivered through Horizon (VDI/Published Apps) or Mobile Apps or SaaS based applications.

vIDM allows us to federate with multiple identity sources at the backend and act as a Single authentication source with SSO capability to be the key to a User Workspace.


vIDM Setup

Its pretty simple and straight forward to deploy vIDM (Workspace) in your LAN setup.
It requires you to deploy the follow the below steps...

1) Deploy vIDM appliance, assign network properties (IP address, netmask, gateway, domain name etc.), create respective DNS records and power it up.

2) Configure it through the UI of the appliance to integrate with the Identity source (like an AD) by providing Base DN, Bind DN and credentials

3) Once we have synced with the AD, map respective backend application sources (e.g. Horizon, Mobile Apps through Airwatch, SaaS apps or Web URLs etc.) to show up as a Catalogue item.

4) Provide Entitlement of these services to the synced users


Access Point Setup

During the deployment of Access Point, i found it to be the most simplest to deploy it using the Powershell scripts.
You can refer to Access Point Deployment Utility (VMware Fling) page for the OVF deployment utility.

The other effective way is to deploy the OVF is using the standard import wizard through the vSphere web client.
I found it convenient to deploy it straight forward by just providing Networking details and leaving the rest sections (i.e. Horizon/Reverse Proxy/Airwatch) blank.

The configuration for integration with vIDM/Horizon/Airwatch can be done later from the Rest API page (https://access-point-appliance.example.com:9443/rest/swagger.yaml)


Refer to the Access Point Installation and Configuration Guide (http://pubs.vmware.com/accesspoint-27/topic/com.vmware.ICbase/PDF/access-point-27-deploy-config-guide.pdf)


Sunday, October 16, 2016

Virtual SAN + vRealize Operations = Effective Storage Management (Part 2)


...In the last post we saw how to configure MPSD (Management Pack for Storage Devices) with vRealize Operations. Lets' see once configured, what do we get out off it.

With the addition of MPSD to vROPS, we get some very useful and simple Dashboards added to the Home View.
For this post, i will showing some Dashboard views of a Hybrid Virtual SAN setup in my lab.

Dashboard 1 : Virtual SAN Troubleshooting

Below are the views from Virtual SAN Troubleshooting Dashboard. Let's have a closer look at them

This one shows a Hierarchical View of the entire Datacenter, mapping Physical Hosts -> VMs -> VSAN Datastore ->  Disk Groups and its respective sub components (SSD/Mechanical Drives)-> the Physical NIC used for the VSAN network.

Clicking any Virtual Machine would highlight the VSAN Datastore its hosted on and the associated membership to other objects in the hierarchy.


If i highlight one of the objects showing a Red Fault (EsxPnic in this case) a respective trendline shows up on the right side, showcasing the pattern and the reason for the fault. 


Likewise we can switch to the "Workload" view and highlight a Red colored object reflecting an anomaly.
In this specific case its a Virtual Machine experiencing an increase in Write Latency.


Dashboard 2: Virtual SAN Heatmap

This dashboard provide a heatmap view of the object performance against the predefined limits vs. its own trended behavior in past.


Dashboard 3: Virtual SAN Entity Usage

This dashboard provides extremely useful data points for all Physical subcomponents of Virtual SAN subsystem, i.e Host Adapter, SSD Cache Drive, Mechanical/SSD Capacity Drives.


At a glance you can make out which specific host and it components is more worked than others in the Virtual cluster.
It also gives us host level performance metrics for SSD/Mechanical disk, for both Read/Write IO patterns. Mostly information which contributes to the performance of the Virtual SAN can be found on this page.


Dashboard 4: Virtual SAN Device Insights

This is a very important Dashboard as it provides insights to disk level counters like reported errors, media endurance indicators etc. which determines the health of the disks. 


Besides this is gives provide details like Capacity utilization values across hosts. If we notice that the data is not distributed uniformly across hosts, we can initiate a rebalance operation to have data equally spread.

Other counters like CPU/memory Utilization, SSD Cache hit ratios etc. are useful for gauging the overall host performance.


Dashboard 5: Virtual SAN Cluster Insights

This dashboard is suitable to gauge disk group level details holistically. If you want to know that which disk group within a host/cluster has the most amount of data, which is most utilized in catering to the IOs, which has most errors or latency...you can check this dashboard.

Its a good starting point for Virtual SAN troubleshooting at a disk group level.


I believe that this configuration in vRealize Operations is a must for any VMware administrator using Virtual SAN. With the help of this specially crafted Management Pack one can easily isolate problem caused at the Storage subsystem and connected SAN devices.


Virtual SAN + vRealize Operations = Effective Storage Management (Part 1)


It's no more a secret that Software Defined Storage is the way forward to craft a true Software Defined Datacenter. With the power of SPBM with VSAN and vVOLs, we can practically take away all the headaches of planning and management of storage blocks.

But once we have created a SDS layer and hit the Day 2 operation stage, there are a lot many things we may want to know about the underlying SDS layer.

The vSphere Web client has some really cool and simplified widgets showcasing data/metrics around capacity utilization and performance, but is kind off limited to that.

In some of my discussions customers has raised queries about granular monitoring of Virtual SAN subcomponents like knowing about disk group level utilization, disk (SSD/Mechanical) level utilization, granular Disk metrics etc.

In this post i would like to spend some time on how to achieve granular monitoring of Virtual SAN using vRealize Operations Manager.


VMware Virtual SAN team along with vRealize Operations team jointly developed the vRealize Operations Management Pack for Storage Devices (MPSD) available at 
Solution Exchange (here). 


The Management Pack provides us with 
  • Pre-defined dashboards that allow you to track data path from VM to VSAN, and notify any problem in the path. 
  • It also shows heat-maps, widgets, metrics for all the sub-components comprising your VSAN environment.

Basically it helps unveil what's happening "Under the Hood".


So without further ado, let me share steps to integrate MPSD with vRealize Operations Management.
You would be surprised to see how radically simple it is.

Its a good idea to check interoperability before we deploy it.


Once you've download the Management Pack (.pak file), Launch the vRealize Operation Manager page. In the left pane of vRealize Operation Manager, Click the Administration icon and click Solutions


On the Right pane, Click the (+) sign and launch the Wizard to upload the Management Pack


Browse to the location of Management Pack for Storage Device and proceed with Upload.
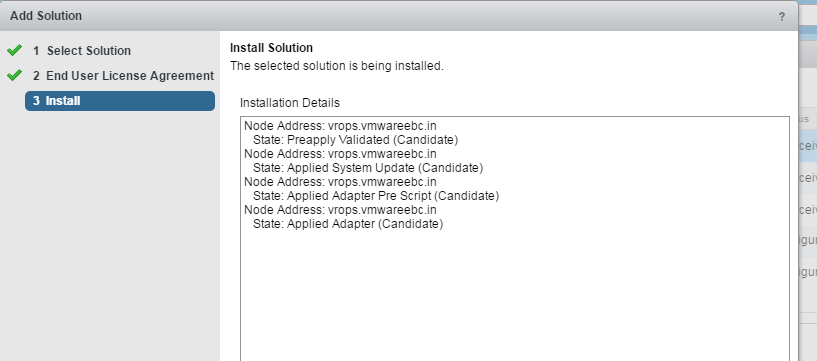
After the upload, Accept the EULA and Proceed for the Install.


Post the Installation, you should see the new Adapter added under the Solution section.

Highlight the Management Pack for Storage Devices and click the Configure button as shown below.


Provide vCenter Credentials for the adapter to connect to the vCenter server and capture the relevant Data points.


Once configured you should wait for it to start "Collecting Data".

As an end result you should see additional Dashboards added to the Home View. 


Given enough time for these Dashboards to populate, it will start reflecting some very handy details about our VM to VSAN configuration. It also provides with FC/iSCSI and NFS mounted Datastore details with metrics from SAN switches and HBA cards.

for usage of these Dashboard views, please see...
Virtual SAN + vRealize Operations = Effective Storage Management (Part 2)


Friday, September 30, 2016

VDI on VxRAIL - Sizing Consideration


VxRAIL is joint collaborative HCI (Hyper-converged Infrastructure) solution by EMC and VMware. Its a fully integrated, preconfigured, pretested HCI solution with vSphere and VSAN sitting at the core of it.

VxRAIL is available in multiple variants, for both Hybrid and All-Flash models (VxRAIL)

One of the most common use case for VxRAIL is for VDI deployments. While some of other posts highlights VDI sizing consideration, VDI on VxRAIL needs some further due diligence.


Here are things you may want to consider while planning for VDI on VxRAIL
  • VxRAIL appliance considered for hosting VDI workload (VxRAIL model defines the compute capability)
  • Maximum number of appliances you may want to have in a cluster
  • Hybrid or All-Flash model (As of today, only All-Flash supports De-duplication and Compression, Erasure Coding etc.)
  • Type of User workload - this will define 
    • De-dupe and compression ratio that can be considered
    • Read/Write Cache Ratio at VSAN level
  • Availability considered during VSAN sizing (FTT=1, FTT=2, Erasure Coding=RAID5/6)
  • Additional/Spare Storage Capacity for 
    • Recover Point VM 
    • Snapshots
    • Swap files etc.
    • Future Growth
Besides these points, you should treat it as standard VDI with Virtual SAN sizing. 
If still in trouble, reach out to your VMware Account SE and he should be able to help you with the sizing.


Thursday, September 29, 2016

VSAN 6.2 - Capacity Planning for Overheads


While creating VSAN Disk group all the disks are formatted with an On-Disk File System.
Like any other File system "VSAN-FS (format type)" has some overheads. This should be considered while capacity planning in VSAN environment.

VSAN 6.2 introduced VSAN-FS version3 (V3) on-disk file system format. This format has an overhead of 1% + Deduplication Metadata

So in practicality 1% of disk capacity + additional Deduplication Metadata overhead should also be factored while capacity calculation.
Here Deduplication metadata overhead refers to the Translation tables and Hash mapping tables created to achieve Deduplication and Compression.

Deduplication metadata is highly variable and depends on the configured data-set (configured during Storage Policy creation)

This can be observed in the Cluster -> Monitor -> Virtual SAN -> Capacity View.

Besides the 1% File System + Deduplication metadata overheads, VMware also recommends considering additional 30% Slack space capacity of the raw storage post disk formatting.

Slack space is to accommodate automatic rebalancing of data when a disk reaches 80% threshold of its capacity. When rebalancing starts it adds to the rebuild traffic on the cluster.
To avoid the traffic surge, VMware recommends to have capacity limited to 10% lesser than the threshold limit...hence 30% additional Slack space capacity.


In summary, besides the FTT/Erasure Coding overheads,  we should also consider 1% File System overhead, Deduplication Metadata overhead and 30% Slack Space Capacity Overhead.


Thursday, September 22, 2016

Virtual SAN - Fault Domain Design Considerations


Fault Domains (FD) in Virtual SAN environment is a concept introduced to provide a Rack/Chassis level redundancy.
In case your Virtual SAN Cluster spans across racks and server chassis (Converged or Hyper-Converged) and you want to hosts to be protected against rack or chassis failure, then you must create Fault Domains and add one or more hosts to each fault domain.

VSAN follows a distributed data locality algorithm to distribute the constructs of an object (replicas/witness/parity etc.) across disk groups of different servers. 

But with additional configuration of Fault Domains, we can enforce VSAN to also distribute the constructs across servers placed in different racks a.k.a Fault Domains than just distributing it across servers within same rack.
So with an appropriate FD design, we can achieve resiliency across rack failures as well.

What do we need to do this.
Firstly we need to ensure that our VSAN Fault Domain configuration matches our server placement in racks.
Let me explain with an example.

Consider below scenario. We have 8 Rack servers forming a VSAN cluster.
I would need a minimum of 3 Fault Domains to be begin with. That's because Fault Domain count = 2 x n + 1
where, n = No. of failure to tolerate

However for best results 4 or more Fault Domains are recommended.

So let's take 4 Fault Domains in the example.


The Blue VM is running with a Storage Policy of FTT = 1
The Orange VM is running with a Storage Policy of Erasure Coding = RAID 5

Since we have configured Fault Domains to include respective ESXis as shown on the right side of the image, you can see the data block for an object are written across the fault domains.
However in absence of FD configuration matching server placement, the data might have got written across servers within the same rack.

This is just an illustration, but to know the exact distribution of the Object blocks, use vSphere Web client go to Virtual Machine -> Monitor -> Policy...Click the Object and check Physical Disk Placement.


For balanced storage loads consider below points as guidelines for configuring Fault Domains
  • Minimum no. of Fault Domains in a VSAN Cluster is 3. For best results configure 4 or more fault domains
  • Possibly assign same no. of hosts to each fault domain
  • Use Hosts with uniform configuration (from disk and compute perspective)
  • Dedicate one Fault Domain of free capacity for rebuilding data after a failure.