Sunday, September 9, 2018

VMware Wavefront - Relevance for your Operations


VMware Wavefront is the new shinny tool in the armory of the VMware Cloud Management suite of solutions.
Wavefront has come to VMware family as a part of an acquisition concluded in May 2017. 

By definition Wavefront is a SaaS based, real-time metric monitoring tool with streaming analytical capabilities. Its powered by a strong analytical engine which can give real time visualization by doing some powerful query based analysis on the pushed stream of metrics.

Some of its Real World Use cases

a. Make DevOps life easy

It primarily targeted for developers as it aims to improve the feedback looping experience as a part of DevOps practice.

OODA loop strategy in ALM cycle is essential for making DevOps truly successful.
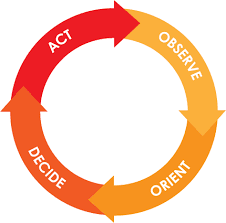

DevOps team would want to reduce the gap between the developers and Ops by extending alerts, monitoring and visualization to the developers directly so they can instantaneously see the impact of let's say a code-commit.
Wavefront can be extended to not just SysOps teams but to SREs and DevOps admins as well.


b. Purpose built for Cloud Native Environments

Wavefront has been developed by engineers who were at one point involved in Google's and Twitter's Containers Ops Management projects. 
They have built Wavefront with a mindset that it should be able to handle CNA environments running with Containers and Microservices at scale.
As we speak, wavefront has support for various Container based services like Dockers, K8s, PKS, Amazon EKS, VMware K8s Engine etc.

It has an easy integration process to capture relevant metrics from a Container based platforms and out of box Dashboards/Visualization to give a clear visibility into the most granular things in container setup.

Example screenshot


Tuesday, March 20, 2018

vRealize Suite LifeCycle Manager - Do it Yourself


vRealize Suite Lifecycle Manager (vRSLCM) is a fantastic approach from VMware to simplify the deployments, minimize administration and ensure best practices adoption for vRealize solution stack.

Organizations who have embraced the journey of Private Cloud and want to take the DIY approach can use vRSLCM as a toolset to manage their Deployments without getting into the granularities of creating low level designing. 
vRSLCM at the backend refers to VMware Validated Designs (VVD) and gives you options for various deployment models.

Its an appropriate tool for Greenfield setup for building up the entire stack from scratch including Installation and Initial Setup
or 
for Brownfield setups for any upgrades or configuration drifts remediations.

The great news is that vRSLCM is a FREE tool for customers who have bought vCloud/vRealize suite.

This post share some of the artifacts on how to use the tool to build up and consume its services.

Step 1
Download vRSLCM OVA from the vmware.com/go/downloads. Deploy the OVA in your vCenter with FQDN, IP Address, DNS, Domain etc details and power it up.

Step 2
Default username is admin@localhost, Default password: vmware

Step 3
Go to the Settings menu and start Tab based configurations


Sunday, February 11, 2018

What is VMware PKS (Pivotal Container Service)


Jointly developed by VMware and Pivotal, VMware Pivotal Container Service (PKS) is a production-grade Kubernetes-based container solution equipped with advanced networking, a private container registry, and full lifecycle management.


Its a Turnkey solution to provision, operate and manage Enterprise grade Kubernetes Cluster at scale on private and public clouds.

Thursday, February 8, 2018

VMware vSAN with vCenter Deployment

One of the apprehensions around adopting a SDS technology is how easy is it to install & configure a SDS solution.
VMware's  focus around this specific point was always to keep it as simple as possible to deploy vSAN.

In a brownfield setup where you have ESXi and vCenter already running, enabling vSAN is as simple as toggling a switch, but i could become a bit tricky if its a fresh setup and you don't have vCenter running already.
So the situation is - vCenter is needed to deploy vSAN, but because vSAN datastore doesn't exist where should we deploy vCenter?

To overcome this, in vCenter 6.5 installation, there are steps included to configure vSAN while installation itself.

This Post describes the steps with Screenshots for same.


Step 1) Mount a vCSA ISO to a Windows machine, and launch the installer


Monday, October 30, 2017

vRealize Automation 7.3 - Integration with SCVMM 2012 R2


vRealize Automation CMP supports multi-hypervisor environment since a long time, however i had rarely found customer using vRA for capabilities beyond vSphere based services. 
However off-late customers who have been successfully using vRA with vSphere has started discussing plans to extend its use cases for integration with SCVMM, Containers, 3rd party ITSM tools etc. 

Hence i thought of putting down some of these integration steps for ease of deployment for similar requirements.
This post would talk about integration of SCVMM with vRA.


Wednesday, August 2, 2017

vRealize Log Insight : vRA Provisioning Status - Custom Dashboards Part 2


The Part 1 of the series explained the procedure to capture the CatalogItem Request Status.
We now will see how in the same UI, we capture the requester details as well.

Post Series PART 2: CatalogItems Requester Details

The one is an easy one. If you observe the below event closely, you will see the RequestedFor section which shows the name of the Requester.


Thursday, July 20, 2017

vRealize Log Insight : vRA Provisioning Status - Custom Dashboards Part 1


Both vROPs and vRLI already have Management Pack and Content Pack respectively for vRealize Automation, which shows a lot of useful information.
However recently one of my customer demanded that as a Business Group owner or Tenant Admin, if i want to see 


  • Catalog-Items requested over time
  • Who all requested which all CatalogItems
  • How many successfully deployed and how many failed
  • How much time did it take for the Catalog Request to complete etc etc... 
...without login to the vRA console, how can we achieve it.

The obvious expectation was to monitor it using vROPs or vRLI. But none of them share this information out of the box. 
So it got me thinking that since all this information is available in form of events in 

/var/log/vmware/vcac/catalina.out, if i can use vRLI Custom Dashboard UI to achieve it.

Hence i started working on this project.

In this series of posts, i will try to share the recipe of creating these Dashboards, as the ingredients are unique for every setup. Which is why you may not find a readymade content pack at the end of this blog :)

To begin with Let's start with the first post...


Post Series PART 1: Catalog-Items Request UI


Monday, July 3, 2017

vRealize Log Insight - Role Based Access Control


Role Based Access Control let system administrators control user access to vRealize Log Insight. This post talks about the configuring RBAC with vRealize Log Insight and using it control the access to sections of vRLI UI.

RBAC can be configured with local users, as well with some central identity source (like Active Directory) based users as well 

vRLI used to offer integration using vIDM and direct Active Directory till v4.3. 
From v4.5 onwards AD integration is deprecated. The option is still available but for users to transition from AD to vIDM integration.


Wednesday, June 28, 2017

vRealize Log Insight - Retention Period Feature Request


Customer who are using vRealize Log Insight has a frequent query around Retention Period for logs. 
Currently to achieve a specific retention period, we need to calculate the Retention basis the log ingestion EPS and the sizing calculation for disk capacity.
Steve Flanders has written a good article around the same available here.

However it may not be necessary that we have a static environment and the log ingestion rate doesn't change. Hence the storage capacity calculation may need to be revisited.

It would be better if we can define retention period based for individual endpoints and possibly by just defining the retention time period value.

Hence i have voted for the Feature Request on loginsight.vmware.com

In case you find the requirement as a useful request, please share your vote for the same.

vRealize Log Insight - Capturing Application Logs


The more we talk about vRLI (vRealize Log Insight), the more are customers falling in love with it.
In today's enterprises either customers would have a generic syslog server-predominantly used for storing logs for future audits/analysis, or, would have an advanced log analytic tool.

Wednesday, March 15, 2017

vRealize Automation VMRC Console - Blank Black Screen


Most of you would already be aware of the "Connect using VMRC" option for a Virtual Machine through the vRealize Automation Self Service Console.

Its one of the most commonly used feature and i have never faced any challenges with it up until one of my customers complaint that they are getting a Black black screen while connecting with VMRC.

I immediately started thinking it towards a port problem.
VMRC through vRA uses TCP port 8444 from endpoint browser to VRA. So we tried a telnet and it worked...hence it wasn't a port issue.


Sunday, February 19, 2017

vRealize Log Insight - vRealize Automation Content Pack Configuration


Recently i got a chance to deploy the vRealize Log Insight (vRLI) Content Pack (CP) for vRA.

I honestly thought configuring it would be as straight forward as its for configuring vSphere CP configuration. However there a few tasks which you would have to perform before you could actually use it. 
Actually this particular CP uses the Agent Group fundamentals to capture details from vRA constructs and put them across in the Dashboards.


Thursday, February 9, 2017

vExpert 2017 Result Announcement


The much awaited vExpert 2017 results were out this morning. You can see the announcements on https://blogs.vmware.com/vmtn/2017/02/vexpert-2017-award-announcement.html


I am much delighted and thankful to the selectors for making me as a part of this coveted group once again this year. 
I also would like to thank readers and and community members for visiting my blogposts and following my posts on social networking sites (twitter and linkedin).


Ill continue working to the best of my capabilities and keep sharing as much as i can.

Wednesday, December 21, 2016

vRealize Operations with SDDC Health Management Pack v2.0


VMware announced SDDC Health Management Pack v2.0 for consumers of SDDC components.The VMware SDDC Management Health Management Pack 2.0 monitors the health of VMware SDDC components in the SDDC stack including the following

VMware vCenter Server
VMware vRealize Operations Manager
VMware vRealize Automation
VMware NSX for vSphere
VMware vSAN
VMware vRealize Business for Cloud
VMware vRealize Log Insight

Monday, November 28, 2016

vSphere Optimization Assessment (VOA) through vRealize Operations


A lot of customers out there have realized the power of vROPs and use the tool for effective monitoring and management of their Datacenter.
The tool gives granular insights to the environment and typically for large scaled environment its a logical to use an analytic tool of such nature.

The out of box reports of the tool helps you gauge the status of the resources and is quite helpful for daily operational purposes.

To improve the reporting, VMware has introduced a new reports which gives exhaustive insight to your environment.

Sunday, November 27, 2016

Upgrading vRealize Operations to 6.4


vRealize Operations 6.4 brings in some really cool advancements in the UI along with some 13 new and amazing out-of-box dashboards. The new Dashboards provide 
a) Summary of the environment
b) VM troubleshooting capabilities. Deeper details like OS, IP address etc.
c) Infrastructure performance and capacity details at the Datacenter level. It now provides key performance indicators for an objects and has ability to highlight issues and related objects to it.

Besides this also introduce support for vSphere 6.5 and Predictive DRS (pDRS)

Predictive DRS : Predictive DRS (pDRS) can proactively load balance a vCenter Server cluster to accommodate predictable patterns.
Where DRS performs load balancing of hosts within a cluster by considering the last five minutes of virtual machine demand, Predictive DRS acts based on data provided to it by vRealize Operations Manager. 
vRealize Operations Manager monitors virtual machines running in a vCenter Server, analyzes longer-term historical data and provides forecast data about predictable patterns of resource usage to Predictive DRS. Predictive DRS moves to balance resource usage based on these predictable patterns.

So in all, vROPs 6.4 brings in a lot cool features which are worth an upgrade.

However there are a few pointers which needs to be considered before you rush to an upgrade
1) Upgrading older versions of vRealize Operations Manager (6.0.x or 6.1) must use a two-step upgrade...They must first upgrade to vRealize Operations Manager 6.3 and then upgrade to vRealize Operations Manager 6.4

2) For recent versions of Realize Operations Manager (6.3, 6.2, or 6.2.1), we can upgrade directly to vRealize Operations Manager 6.4
3) Upgrading to vROPs 6.4 includes upgrading 2 pak files
a. The OS pak file
b. the Virtual Appliance pak file 
4) Make sure a snapshot of each node in the vROPs cluster is taken before we start the upgrade
5) Take a backup of any customization, configurations, custom dashboard etc. being created before the starting the upgrade procedure.

Follow the instructions on the "Updating your Software" Link and you should be able to upgrade to vROPs 6.4 without any issues.

VMware Identity Manager Integration with Access Point


VMware Identity Manager also known as vIDM is recently introduced SSO engine which is now used across VMware solutions around EUC and Mobility solutions.
Most of the customers love vIDM is because of its ability to provide single unified interface for accessing your application, which could be apps delivered through Horizon (VDI/Published Apps) or Mobile Apps or SaaS based applications.

vIDM allows us to federate with multiple identity sources at the backend and act as a Single authentication source with SSO capability to be the key to a User Workspace.


vIDM Setup

Its pretty simple and straight forward to deploy vIDM (Workspace) in your LAN setup.
It requires you to deploy the follow the below steps...

1) Deploy vIDM appliance, assign network properties (IP address, netmask, gateway, domain name etc.), create respective DNS records and power it up.

2) Configure it through the UI of the appliance to integrate with the Identity source (like an AD) by providing Base DN, Bind DN and credentials

3) Once we have synced with the AD, map respective backend application sources (e.g. Horizon, Mobile Apps through Airwatch, SaaS apps or Web URLs etc.) to show up as a Catalogue item.

4) Provide Entitlement of these services to the synced users


Access Point Setup

During the deployment of Access Point, i found it to be the most simplest to deploy it using the Powershell scripts.
You can refer to Access Point Deployment Utility (VMware Fling) page for the OVF deployment utility.

The other effective way is to deploy the OVF is using the standard import wizard through the vSphere web client.
I found it convenient to deploy it straight forward by just providing Networking details and leaving the rest sections (i.e. Horizon/Reverse Proxy/Airwatch) blank.

The configuration for integration with vIDM/Horizon/Airwatch can be done later from the Rest API page (https://access-point-appliance.example.com:9443/rest/swagger.yaml)


Refer to the Access Point Installation and Configuration Guide (http://pubs.vmware.com/accesspoint-27/topic/com.vmware.ICbase/PDF/access-point-27-deploy-config-guide.pdf)


Sunday, October 16, 2016

Virtual SAN + vRealize Operations = Effective Storage Management (Part 2)


...In the last post we saw how to configure MPSD (Management Pack for Storage Devices) with vRealize Operations. Lets' see once configured, what do we get out off it.

With the addition of MPSD to vROPS, we get some very useful and simple Dashboards added to the Home View.
For this post, i will showing some Dashboard views of a Hybrid Virtual SAN setup in my lab.

Dashboard 1 : Virtual SAN Troubleshooting

Below are the views from Virtual SAN Troubleshooting Dashboard. Let's have a closer look at them

This one shows a Hierarchical View of the entire Datacenter, mapping Physical Hosts -> VMs -> VSAN Datastore ->  Disk Groups and its respective sub components (SSD/Mechanical Drives)-> the Physical NIC used for the VSAN network.

Clicking any Virtual Machine would highlight the VSAN Datastore its hosted on and the associated membership to other objects in the hierarchy.


If i highlight one of the objects showing a Red Fault (EsxPnic in this case) a respective trendline shows up on the right side, showcasing the pattern and the reason for the fault. 


Likewise we can switch to the "Workload" view and highlight a Red colored object reflecting an anomaly.
In this specific case its a Virtual Machine experiencing an increase in Write Latency.


Dashboard 2: Virtual SAN Heatmap

This dashboard provide a heatmap view of the object performance against the predefined limits vs. its own trended behavior in past.


Dashboard 3: Virtual SAN Entity Usage

This dashboard provides extremely useful data points for all Physical subcomponents of Virtual SAN subsystem, i.e Host Adapter, SSD Cache Drive, Mechanical/SSD Capacity Drives.


At a glance you can make out which specific host and it components is more worked than others in the Virtual cluster.
It also gives us host level performance metrics for SSD/Mechanical disk, for both Read/Write IO patterns. Mostly information which contributes to the performance of the Virtual SAN can be found on this page.


Dashboard 4: Virtual SAN Device Insights

This is a very important Dashboard as it provides insights to disk level counters like reported errors, media endurance indicators etc. which determines the health of the disks. 


Besides this is gives provide details like Capacity utilization values across hosts. If we notice that the data is not distributed uniformly across hosts, we can initiate a rebalance operation to have data equally spread.

Other counters like CPU/memory Utilization, SSD Cache hit ratios etc. are useful for gauging the overall host performance.


Dashboard 5: Virtual SAN Cluster Insights

This dashboard is suitable to gauge disk group level details holistically. If you want to know that which disk group within a host/cluster has the most amount of data, which is most utilized in catering to the IOs, which has most errors or latency...you can check this dashboard.

Its a good starting point for Virtual SAN troubleshooting at a disk group level.


I believe that this configuration in vRealize Operations is a must for any VMware administrator using Virtual SAN. With the help of this specially crafted Management Pack one can easily isolate problem caused at the Storage subsystem and connected SAN devices.


Virtual SAN + vRealize Operations = Effective Storage Management (Part 1)


It's no more a secret that Software Defined Storage is the way forward to craft a true Software Defined Datacenter. With the power of SPBM with VSAN and vVOLs, we can practically take away all the headaches of planning and management of storage blocks.

But once we have created a SDS layer and hit the Day 2 operation stage, there are a lot many things we may want to know about the underlying SDS layer.

The vSphere Web client has some really cool and simplified widgets showcasing data/metrics around capacity utilization and performance, but is kind off limited to that.

In some of my discussions customers has raised queries about granular monitoring of Virtual SAN subcomponents like knowing about disk group level utilization, disk (SSD/Mechanical) level utilization, granular Disk metrics etc.

In this post i would like to spend some time on how to achieve granular monitoring of Virtual SAN using vRealize Operations Manager.


VMware Virtual SAN team along with vRealize Operations team jointly developed the vRealize Operations Management Pack for Storage Devices (MPSD) available at 
Solution Exchange (here). 


The Management Pack provides us with 
  • Pre-defined dashboards that allow you to track data path from VM to VSAN, and notify any problem in the path. 
  • It also shows heat-maps, widgets, metrics for all the sub-components comprising your VSAN environment.

Basically it helps unveil what's happening "Under the Hood".


So without further ado, let me share steps to integrate MPSD with vRealize Operations Management.
You would be surprised to see how radically simple it is.

Its a good idea to check interoperability before we deploy it.


Once you've download the Management Pack (.pak file), Launch the vRealize Operation Manager page. In the left pane of vRealize Operation Manager, Click the Administration icon and click Solutions


On the Right pane, Click the (+) sign and launch the Wizard to upload the Management Pack


Browse to the location of Management Pack for Storage Device and proceed with Upload.
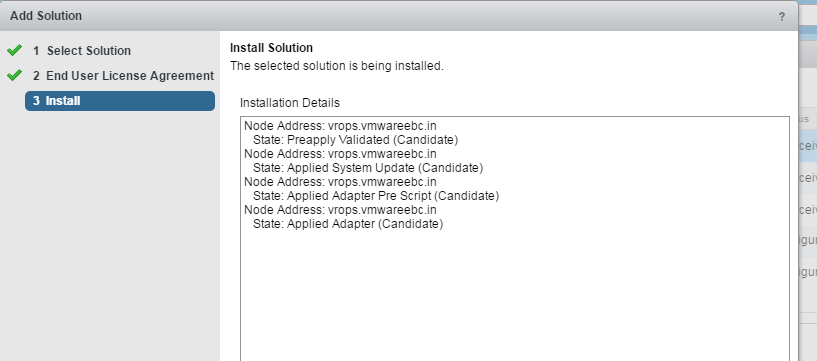
After the upload, Accept the EULA and Proceed for the Install.


Post the Installation, you should see the new Adapter added under the Solution section.

Highlight the Management Pack for Storage Devices and click the Configure button as shown below.


Provide vCenter Credentials for the adapter to connect to the vCenter server and capture the relevant Data points.


Once configured you should wait for it to start "Collecting Data".

As an end result you should see additional Dashboards added to the Home View. 


Given enough time for these Dashboards to populate, it will start reflecting some very handy details about our VM to VSAN configuration. It also provides with FC/iSCSI and NFS mounted Datastore details with metrics from SAN switches and HBA cards.

for usage of these Dashboard views, please see...
Virtual SAN + vRealize Operations = Effective Storage Management (Part 2)


Friday, September 30, 2016

VDI on VxRAIL - Sizing Consideration


VxRAIL is joint collaborative HCI (Hyper-converged Infrastructure) solution by EMC and VMware. Its a fully integrated, preconfigured, pretested HCI solution with vSphere and VSAN sitting at the core of it.

VxRAIL is available in multiple variants, for both Hybrid and All-Flash models (VxRAIL)

One of the most common use case for VxRAIL is for VDI deployments. While some of other posts highlights VDI sizing consideration, VDI on VxRAIL needs some further due diligence.


Here are things you may want to consider while planning for VDI on VxRAIL
  • VxRAIL appliance considered for hosting VDI workload (VxRAIL model defines the compute capability)
  • Maximum number of appliances you may want to have in a cluster
  • Hybrid or All-Flash model (As of today, only All-Flash supports De-duplication and Compression, Erasure Coding etc.)
  • Type of User workload - this will define 
    • De-dupe and compression ratio that can be considered
    • Read/Write Cache Ratio at VSAN level
  • Availability considered during VSAN sizing (FTT=1, FTT=2, Erasure Coding=RAID5/6)
  • Additional/Spare Storage Capacity for 
    • Recover Point VM 
    • Snapshots
    • Swap files etc.
    • Future Growth
Besides these points, you should treat it as standard VDI with Virtual SAN sizing. 
If still in trouble, reach out to your VMware Account SE and he should be able to help you with the sizing.